Thought I’d share this article from CityLab.com by Tanvi Misra that displays the shortage of affordable housing by state. (Gotta love visual learning.)
On a national level, there’s a shortage of 3.9 million affordable homes for low income families. This translates to only 35 units per 100 extremely poor families. Yikes. By state, Alabama has the most, with 61 units. Breakin’ it down by metro area, Las Vegas has only 12 units per 100 families, and Boston has the most, with 46 units per 100. ‘Murica, we can do better.
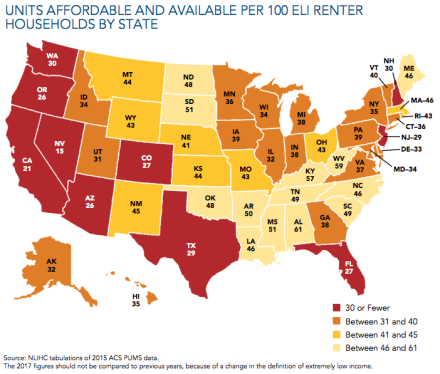
From CityLab.com. Any of these states catch you by surprise?
This is causing a chain reaction across income levels. Because of the shortage of affordable housing rental units, families with middle income levels are forced into the units that are for lower income families. In fact, of the 7.5 million rental units that are considered affordable for low income families, 3.5 of them are occupied by a higher income level renter.
What does this mean? It means that a good chunk (over 30%) of a family’s income is spent on housing, leaving less money for other expenses, such as food, health care, transportation, and higher education. Imagine having to choose between your prescription medication or dinner. (In fact, the National Low Income Housing Coalition estimates that 71% of extremely poor families spend over half of their income on rent and utilities.)
What’s the solution here? More affordable housing, of course. But that’s easier said than done, with housing assistance policies such as the Low Income Tax Housing Tax Credit that may not be interesting to developers anymore, and the Mortgage Income Tax Deduction. From the article:
Housing assistance policies have not caught up to this new reality. Reforming the Low Income Tax Housing Tax Credit, a key program that helps build affordable housing so it better addresses the needs of the most burdened renters, is one recommendation NLIHC makes in the report. Housing advocates also argue that the Mortgage Income Tax Deduction, which is designed to promote homeownership, is ineffective.
You can read the rest of the article here. Feeling slightly overwhelmed and not sure how to help? Learn how Bike and Build is making an impact on affordable housing across the country, and click here to check out why I’m getting involved.

Hey Kerry: Great job on getting to 85%, let me know if you need anymore help to achieving the full 100%.
An aside, if you have any pull at City Lab, get them to reverse the shading/color on that map: Red should indicate the worse scenario for the availability of AH.
Auntie Gail
Sent from my iPhone
>
LikeLike
Hi Ms. Gail!
I see your point re: the map coloring. It is a bit confusing to interpret, but the states with the lowest number of affordable rental units available are the deepest color. Perhaps the map would be more clear to use the number of affordable units -needed- rather than what’s available. For instance, to say that Nevada needs 85 more units rather than say the state has 15 available.
Thanks for reading, and I appreciate your support!
LikeLike